 |
| Series Resonant Circuit, Positive Reactance Data |
cialog Reactance Resolution
When the CIA-HF uploads 100 reactance points to the computer, the data is always transferred in an unsigned (all positive) representation. Reactance is defined to be a signed quantity. Negative reactance is also called capacitive reactance, and positive reactance is called inductive reactance. It is desirable to be able to determine what reactance data should be assigned a negative value, so that the traces follow normal conventions.
Any attempt to resolve the sign of the reactance into positive and negative regions must be based upon no more than the unsigned resistance and unsigned reactance data - that's all that's available for analysis.
The CIA-HF is similar to several other popular antenna analyzer products that share the property that they report a reactance value, but do not report the sign of the reactance.
If it were possible to accurately determine the sign of the reactance from just the unsigned resistance and reactance data, then all of these products would do so.
The problem is that it is not possible to resolve the reactance sign with 100% accuracy given just the unsigned resistance and reactance value. This is because there are two different ways that reactance changes with respect to itself, and when combined with resistance data. One of the reactance resolution models will be correct, and the other will be incorrect. cialog implements both models, and includes a detection algorithm which attempts to select the correct model. The automatic mechanism can arrive at the wrong conclusion. For that reason, it is possible to manually select the desired model, or disable the entire resolution mechanism.
The following sections describe the two different reactance resolutions models.
The X Slope reactance resolution model considers only the slope of the reactance data. This model is appropriate for series resonant circuits which are directly connected to the CIA-HF. Consider a typical dipole antenna, near resonance. We know that the reactance will be capacitive or negative below resonance. As resonance is approached, the reactance will move towards zero. Resonance is defined to be the frequency where the reactance is zero. Above the resonant frequency of the dipole, the reactance will increase, and become positive, or inductive.
When examining the unsigned reactance data, the slope of the data suggested whether the data should be interpreted as negative, or positive. When you note a decrease in data as the frequency rises, the reactance is considered negative, since it appears to be trending towards zero, which is what capacitive reactance does below resonance. If the data is increasing in value, then the data is assumed to be positive, since inductive or positive reactance does indeed increase as you move past the point of resonance with increasing frequency. This model is suggested in some of the antenna analyzer instruction manuals. You rock the frequency back and forth, and observe if the unsigned reactance data is getting larger (positive slope), or smaller (negative slope). Negative slope regions translate to negative reactance, and positive slope regions translate to positive reactance.
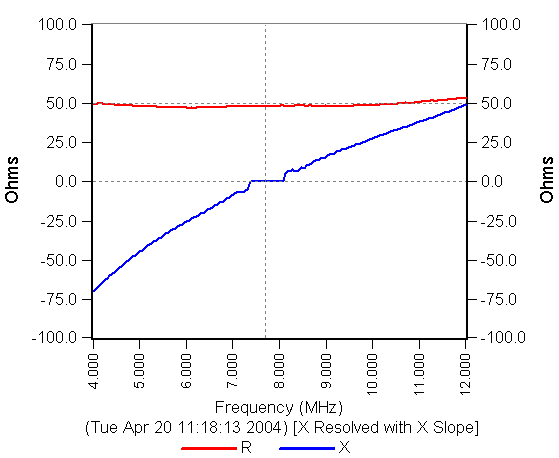
Here is an example. I built a very simple series resonant circuit designed to mimic a typical antenna. It consists of a 50 Ohm resistor in series with a 390 pf capacitor and a length of inductor. The combination resonates around 7.6 MHz. I connected the circuit to the CIA-HF, and performed a resistance and reactance sweep from 4 to 12 MHz. Here is the resulting data. Note, the reactance data is all positive (raw) in this example. In other words, it is what was uploaded from the CIA-HF without modification.
 |
| Series Resonant Circuit, Positive Reactance Data |
The dotted vertical line is the computed resonant frequency, which is in the middle of the region which reported zero Ohms reactance. The reactance data to the left of resonance slopes downward. Above resonance, it slopes upward. We know, by definition, that the reactance should be reported as negative below resonance, and positive above resonance.
The X Slope algorithm uses a sliding window analysis to determine the slope of the reactance data at every point on the graph. The window includes a threshold test to deal with slight upward and downward movements in reactance which are due to the accuracy of the CIA-HF, and not really part of the device under test. When a reactance data point is found in a region of negative slope, the data is multiplied by -1 to flip the sign.
Here is a graph of the exact same device, but this time the X Slope algorithm was turned on.
 |
| Effect of X Slope Resolution |
In this case, the X Slope algorithm provides the correct result. Note that the resolution model is printed on the graph ([X Resolved with X Slope]).
The X Slope reactance sign resolution model is insufficient to describe all cases. For the next example, I took the same series resonant circuit, and connected it to the CIA-HF through approximately 60 feet of RG-58 transmission line. Here was the resulting resistance and reactance data, measured at the CIA-HF, when the frequency was swept from 10 to 16 MHz. The reactance resolution algorithm was turned off, this is the raw positive data directly from the CIA-HF.
 |
| Parallel Resonant Circuit, Positive Reactance Data |
The signature that this data suggests is that of a parallel resonant circuit. The resistance peak is normal, but the blue reactance data, being all positive, is a real disaster. Let's apply the X Slope algorithm to this data. The next graph shows that result.
 |
| Incorrect X Slope Application |
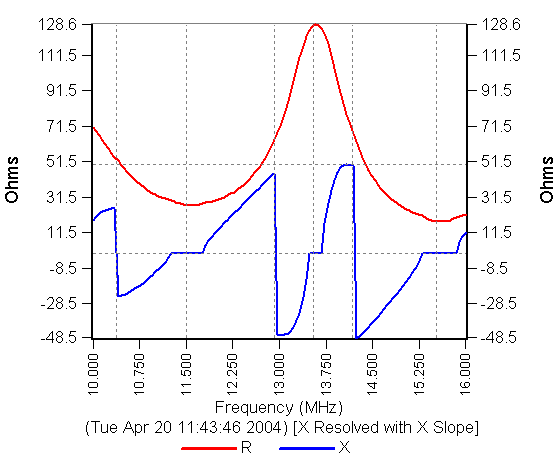
From the previous section, the X Slope algorithm considers all positive slope reactance data to be positive, and all negative slope reactance data to be negative. The effect of this algorithm on this data is to create the discontinuities when the reactance data has a maximum or minimum peak. These are the vertical lines.
In order to correctly resolve the sign of the reactance, it is necessary to consider the resistance, as well as the reactance. That is why this algorithm is called the X + R Slope model.
When the sign of the slope of the resistance agrees with the slope of the reactance, the X Slope resolution is correct. When they differ, the X Slope resolution is backwards. The next graph shows the result of the X + R Slope resolution algorithm.
 |
| Correct X + R Slope Application |
Finally, the correct reactance sign across the entire graph.
The tip off that the X Slope resolution algorithm is incorrect is the discontinuous reactance data (vertical lines). The cialog automatic resolution mode first applies the X Slope resolution. Then, it looks for discontinuities in the data. If there are any, the X + R Slope algorithm is applied.
There are regions on this graph where the CIA-HF reports an extended zone of zero reactance Ohms. I do not know if that is a characteristic of all CIA-HF units, or if my unit is either broken, or out of adjustment.
There are four different reactance resolutions modes. They are selected with the Resolve the Reactance Sign popup menu on the CIA menu. Note that reactance resolution is performed only when data is captured. If you want to change the resolution mode, you must change the menu, then recapture data so that the new choice is actually used. Reactance resolution is a capture activity, not a graphing activity.
The four different modes are:
The reactance resolution algorithm is performed before any transmission line transformations are computed.
NOTE: the reactance resolution algorithms rely upon computing the slope of regions of reactance and resistance data. The algorithms will become confused and fail if the data is unstable, and the points are not continuous. This can happen for several reasons. One reason is that the CIA-HF, or the device under test, is too close to a noisy source such as a computer. The noise gets into the CIA-HF, causing spikes on the reactance data. These spikes confuse the slope detection. Another source of confusion can be sample frequencies which are too wide apart, and do not closely follow the data.
Last update:
Friday, June 18, 2004 03:18:51 PM
Back to the cialog Home Page